

Image Details
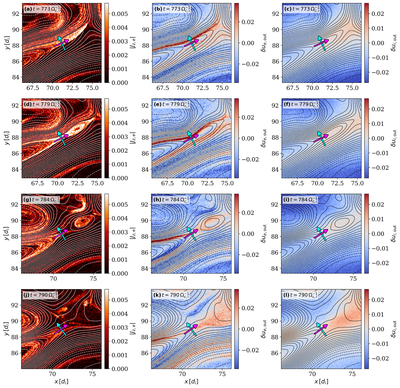
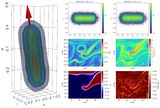
Caption: Figure A1.
Local structure around a representative magnetic X-point at t = (773, 779, 784, ﹩790){{\rm{\Omega }}}_{c,i}^{-1}﹩. The left column shows the electron out-of-plane current density ∣Jz,e∣, while the middle and right columns show the projected electron and ion outflow velocities, δue,out and δui,out, respectively, defined relative to the center-of-mass velocity at the X-point. Black contours represent the magnetic flux function ψ. The magenta triangle marks the X-point, while the magenta and cyan arrows indicate the local exhaust and normal directions, ﹩\hat{{\boldsymbol{t}}}﹩ and ﹩\hat{{\boldsymbol{n}}}﹩, respectively.
Other Images in This Article
Copyright and Terms & Conditions
© 2026. The Author(s). Published by the American Astronomical Society.

