

Image Details
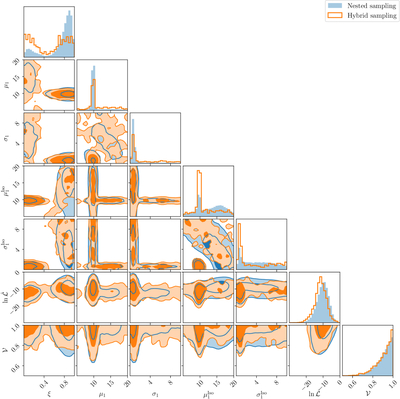
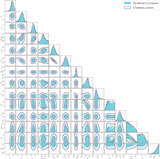
Caption: Figure C2.
Marginal posteriors on the branching ratio ξ between truncated Gaussian and isotropic spin tilt distributions (below the transition mass), as well as the location (﹩{\mu }_{1}\,\mathrm{and}\,{\mu }_{1}^{\,{\rm{Iso}}\,}﹩) and scale (﹩{\sigma }_{1}\,\mathrm{and}\,{\sigma }_{1}^{\,{\rm{Iso}}\,}﹩) of the first peak in the primary mass distributions, under a variation of the SUBPOPULATIONS model where the truncated Gaussian vs. isotropic tilt distributions each have their own mass distribution (see Appendix C.3). We also show the log-likelihood estimator ﹩\mathrm{ln}\hat{{ \mathcal L }}﹩ and the variance ﹩{ \mathcal V }﹩ of that estimator. Log likelihoods are shown relative to the maximum likelihood.
Other Images in This Article
Show More
Copyright and Terms & Conditions
© 2026. The Author(s). Published by the American Astronomical Society.

