

Image Details
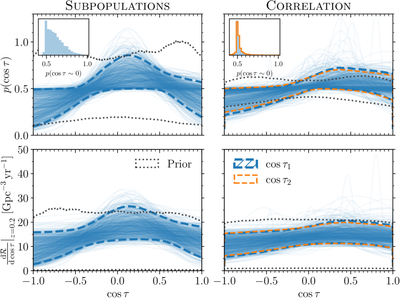
Caption: Figure 1.
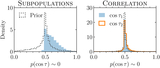
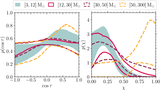
PPDs of the marginal density (top) and differential merger rate (bottom) of sources as a function of spin tilt τ under the SUBPOPULATIONS model (left) and CORRELATION model (right). Dashed lines enclose the 90% credible region and transparent lines are 103 random draws from the posterior. Since component tilts are not identically distributed in the CORRELATION model, we show the 90% credible bounds for both the primary (blue) and secondary (orange). In the top row, we include insets with the posterior on the marginal population density near ﹩\cos \tau \sim 0﹩. We show the 90% credible bounds of the prior population distributions with gray dotted lines; insets are reproduced with priors in Figure 10.
Other Images in This Article
Show More
Copyright and Terms & Conditions
© 2026. The Author(s). Published by the American Astronomical Society.

