

Image Details
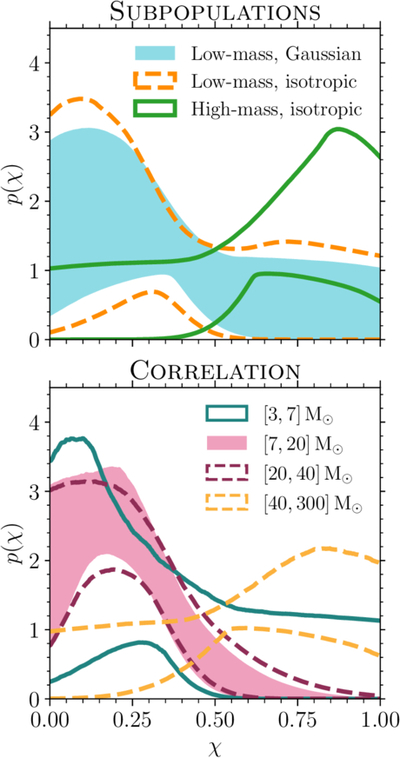
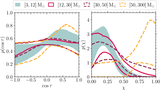
Caption: Figure 4.
PPDs on the marginal density of sources as a function of spin magnitude χ under both models. Top: results obtained with SUBPOPULATIONS model, for BHs in the low-mass + Gaussian tilts (blue), low-mass + isotropic tilts (orange, dashed), and high-mass + isotropic tilts (green) subpopulations. Bottom: results obtained under the CORRELATION model, in each bin of BH mass. Lines or shading enclose the 90% credible region.
Other Images in This Article
Show More
Copyright and Terms & Conditions
© 2026. The Author(s). Published by the American Astronomical Society.

Copyright ©
2026 Astronomy Image Explorer. All Rights Reserved.
