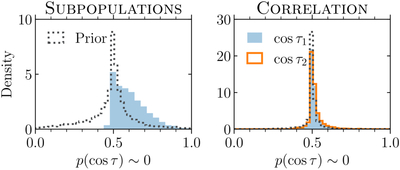
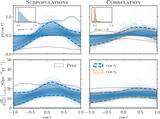
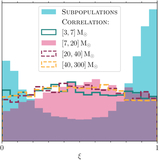
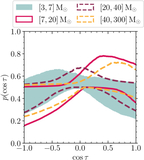
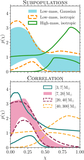
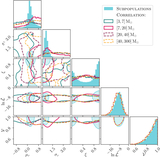
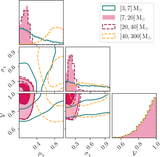
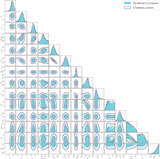
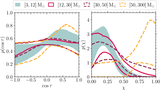
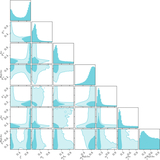
Inset figures from Figure 1 showing priors and posteriors on the marginal density of the population-level spin tilt distribution averaged over a window of ±0.1 around ﹩\cos \tau =0﹩ under the SUBPOPULATIONS (left) and CORRELATION (right) models. Colors and line styles match Figure 1.