

Image Details
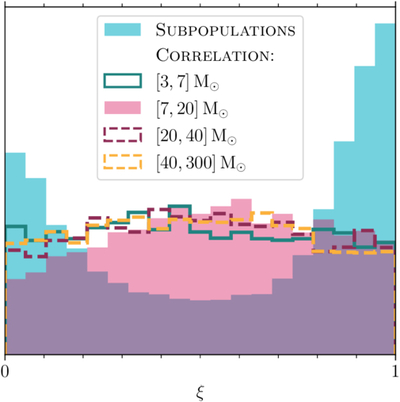
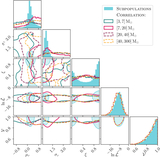
Caption: Figure 2.
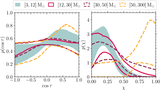
The fraction ξ of sources in the Gaussian peak below ﹩\tilde{m}﹩ in the SUBPOPULATIONS model (blue), as well as ξ within each mass bin under the CORRELATION model.
Other Images in This Article
Show More
Copyright and Terms & Conditions
© 2026. The Author(s). Published by the American Astronomical Society.

Copyright ©
2026 Astronomy Image Explorer. All Rights Reserved.
