

Image Details
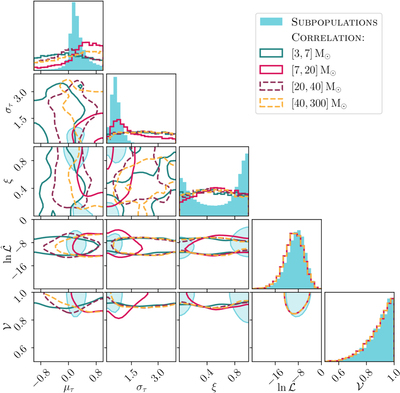
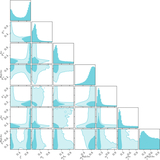
Caption: Figure E2.
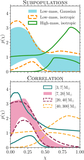
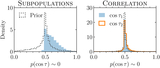
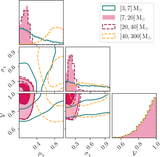
Marginal posteriors on the location μτ and scale στ of the truncated Gaussian in spin tilts, as well as the branching ratio ξ of truncated Gaussian vs. isotropic tilt distribution. We also show the log-likelihood estimator ﹩\mathrm{ln}\hat{{ \mathcal L }}﹩ and variance ﹩{ \mathcal V }﹩ of that estimator. Log likelihoods are shown relative to the maximum likelihood obtained under either model. Results shown are obtained under the SUBPOPULATIONS model (blue, filled regions) as well as in each mass bin under the CORRELATION model (solid and dashed lines). For clarity, shading or lines only enclose the 50% credible region. Note that στ appears better measured under the SUBPOPULATIONS model as we used a truncated Gaussian prior on στ, whereas we used a uniform prior in the CORRELATION model (see Table 1).
Other Images in This Article
Show More
Copyright and Terms & Conditions
© 2026. The Author(s). Published by the American Astronomical Society.

