

Image Details
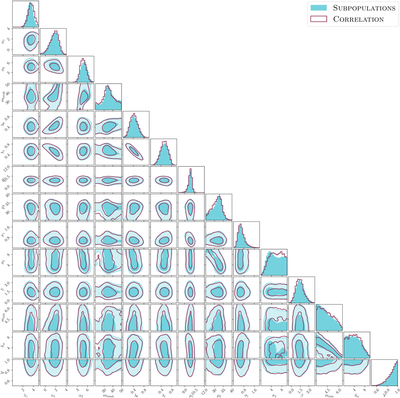
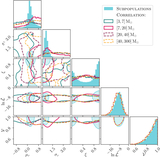
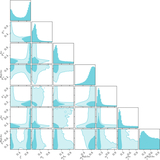
Caption: Figure E4.
Marginal posteriors on the parameters of the primary mass, mass ratio, and redshift population distributions obtained under the SUBPOPULATIONS model (blue, filled regions) as well as the CORRELATION model (purple lines). See Table 2 for parameter definitions and priors. We also show the variance ﹩{ \mathcal V }﹩ of the log-likelihood estimator. Contours enclose the 50% and 90% credible regions.
Other Images in This Article
Show More
Copyright and Terms & Conditions
© 2026. The Author(s). Published by the American Astronomical Society.

Copyright ©
2026 Astronomy Image Explorer. All Rights Reserved.
