

Image Details
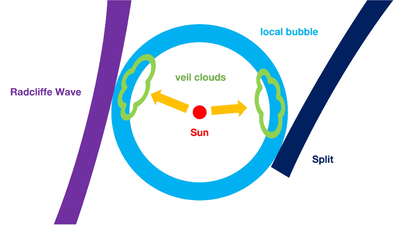
Caption: Figure 6.
Schematic of veil clouds relative to the Local Bubble and other large-scale structures. The red circle shows the solar system, while orange arrows indicate two sight lines rich in such clouds. The boundary of the Local Bubble is outlined by the blue circle. Purple and dark blue strips represent the Radcliffe Wave and the Split, respectively. Green cloud-shaped symbols denote regions where veil clouds are densely clustered adjacent to the Local Bubble.
Other Images in This Article
Copyright and Terms & Conditions
© 2026. The Author(s). Published by the American Astronomical Society.

Copyright ©
2026 Astronomy Image Explorer. All Rights Reserved.
