

Image Details
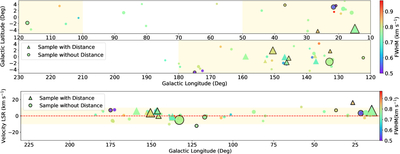
Caption: Figure 4.
Global distribution of the 57 structures. The top panel shows their positions in Galactic longitude–latitude (l–b) space, while the bottom panel displays their distribution in longitude–velocity (l–v). The symbols are the same as in Figure 1, with the color representing the observed 12CO line width. The light-gold shaded region in the l–b panel marks spatial concentrations (l = 10°–50° and l = 100°–180°), while that in the l–v panel corresponds to the velocity confinement (∣VLSR∣ ≤ 10 km s−1).
Other Images in This Article
Copyright and Terms & Conditions
© 2026. The Author(s). Published by the American Astronomical Society.

Copyright ©
2026 Astronomy Image Explorer. All Rights Reserved.
