

Image Details
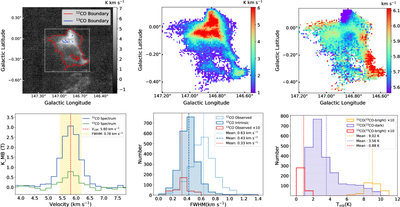
Caption: Figure 2.
Top left: integrated intensity map of 12CO emission from cloud G146.845-00.095+005.80 (ID 41) over the velocity interval 4–7.5 km s−1. The red contour outlines the boundary of the 12CO structure, while the blue contour shows the boundary of the 13CO structure extracted within the 12CO structure. Top middle: integrated intensity map of 12CO reconstructed via the GaussPy+ and ACORNS algorithms. Top right: centroid velocity of 12CO. Bottom left: average spectra of 12CO (blue) and 13CO (green), smoothed to 0.2 km s−1, with a centroid velocity of 5.80 km s−1 and an FWHM of 0.78 km s−1(Here, ﹩{\rm{FWHM}}=2\sqrt{2\mathrm{ln}2}\,{v}_{{\rm{disp}}}﹩, derived from the whole cloud velocity dispersion, see Column (5) in Table 1). Bottom middle: pixel-by-pixel line width distributions for 12CO (light blue), 13CO (red), and opacity-corrected 12CO in 13CO-dark regions (dark blue). The number of data points from 13CO-bright regions in each bin is scaled by a factor of 10 relative to the original count. Bottom right: brightness temperature distributions of 12CO in 13CO-dark regions (purple), and 12CO in 13CO-bright regions (orange), and 13CO (red).
Other Images in This Article
Copyright and Terms & Conditions
© 2026. The Author(s). Published by the American Astronomical Society.

