

Image Details
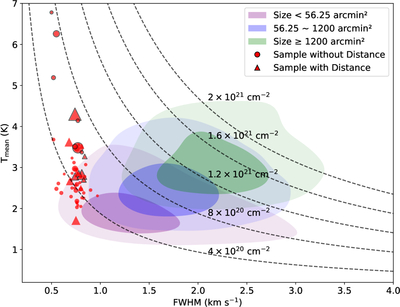
Caption: Figure 1.
Distribution of 12CO structures in the FWHM (Column (6) in Table 1) versus mean temperature. CO structures with narrow lines are shown as red triangles (with distance) and red circles (without distance), where the symbol size is proportional to the projected area of the 12CO emission. Clouds outlined in black indicate those with a 13CO projected area larger than ﹩10\,{{\rm{arcmin}}}^{2}﹩. The purple, blue, and green shaded regions mark the kernel density estimation (KDE) of MCs grouped by spatial scale in the FWHM–Tmean plane, where darker shades indicate regions of higher cloud number density (i.e., the densest 30% according to the KDE). The black dashed line shows the trend of constant H2 column density derived using the XCO-factor (i.e., ﹩{X}_{{\rm{CO}}}=2\times 1{0}^{20}\,{{\rm{cm}}}^{-2}\,{({\rm{K}}\,{\rm{km}}\,{{\rm{s}}}^{-1})}^{-1}﹩; A. D. Bolatto et al. 2013).
Other Images in This Article
Copyright and Terms & Conditions
© 2026. The Author(s). Published by the American Astronomical Society.

