

Image Details
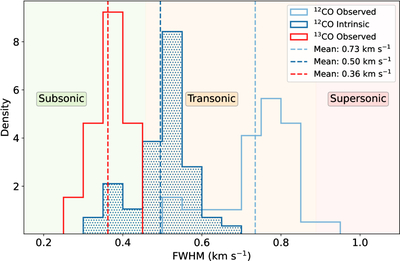
Caption: Figure 3.
Distribution of CO line widths for the 57 structures. The light and dark blue solid lines show the observed and optical-depth-corrected 12CO line widths, respectively. The red solid line represents the observed 13CO line widths for the 13 clouds with a projected area ﹩\gt 10\,{{\rm{arcmin}}}^{2}﹩. Vertical dashed lines mark the corresponding mean values for each distribution. The color shadings mark the velocity intervals corresponding to subsonic, transonic, and supersonic regimes for a gas temperature of 10 K.
Other Images in This Article
Copyright and Terms & Conditions
© 2026. The Author(s). Published by the American Astronomical Society.

Copyright ©
2026 Astronomy Image Explorer. All Rights Reserved.
