

Image Details
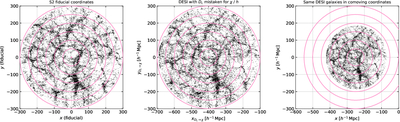
Caption: Figure 5.
Consequence of the mistaken distance coordinates in the S2 dataset. The left panel shows the S2 data in published coordinates. The center panel shows DESI data, but plotted using the mistaken identification of luminosity distance in Mpc with comoving distance in h−1 Mpc. The right panel shows the same DESI data, but in true comoving coordinates. Pink circles are equally spaced in intervals of 50 units on each panel. The mistaken transformation both spuriously scales and deforms the data. Small differences in the galaxy sample arise from differences in the selection function, luminosity distance calculation, and assumed cosmology.
Other Images in This Article
Copyright and Terms & Conditions
© 2026. The Author(s). Published by the American Astronomical Society.

