

Image Details
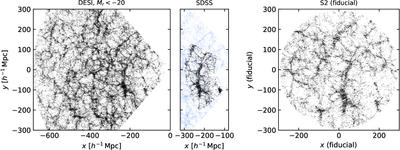
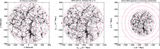
Caption: Figure 1.
Comparison of galaxy distributions in DESI DR1, SDSS, and S2. The left panel shows the distribution of galaxies in a slice of thickness 40 h−1 Mpc within the DESI DR1 footprint. The central panel shows galaxies in the overlap region with SDSS centered on the “Sloan Great Wall,” with DESI data shown in light blue, and SDSS data shown in black. The observer is located on the right, at x = 0. The right panel shows the spatial distribution in the S2 data, with a diameter of 600, and the observer assumed at x ≃ 400, both in the published S2 coordinates. The prominent structure visible in S2 can be identified as an enlarged and slightly distorted projection of the Sloan Great Wall.
Other Images in This Article
Copyright and Terms & Conditions
© 2026. The Author(s). Published by the American Astronomical Society.

