

Image Details
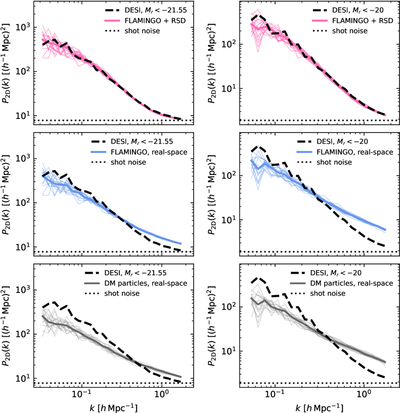
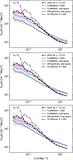
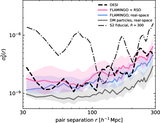
Caption: Figure 7.
Power spectra comparison between DESI and individual slices of FLAMINGO at z = 0.15. The left column shows the comparison in cylinders of R = 290 h−1 Mpc, similar to Figure 3. The right column shows the comparison in cylinders of R = 175 h−1 Mpc, approximately the true size of the S2 region. Thin colored lines show individual power spectra in slices of the FLAMINGO simulation, from galaxy positions in redshift space (top), galaxy positions in real space (middle), or simulation particles (bottom). Thick lines show the corresponding medians. Dotted lines indicate the shot-noise level. When redshift-space distortions are included, and the comparison is performed at the correct scale, the DESI DR1 data are fully compatible with the FLAMINGO data on all scales.
Other Images in This Article
Copyright and Terms & Conditions
© 2026. The Author(s). Published by the American Astronomical Society.

