

Image Details
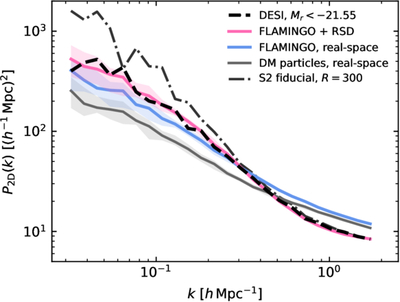
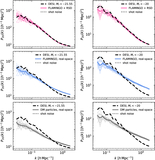
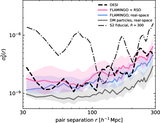
Caption: Figure 3.
Power-spectra comparison between DESI, FLAMINGO, and S2. The dashed black line shows the 2D windowed power spectrum in the R = 290 h−1 Mpc cylinder from DESI DR1. The dashed–dotted line shows the power spectrum measured for S2 in fiducial coordinates. Colored lines show the median power spectra in geometry-matched slices of the FLAMINGO simulation at z = 0.15, measured using galaxies accounting for redshift-space distortions (pink), galaxies in real space (blue), or simulation particles (gray). Bands show percentiles equivalent to ±1σ across all samples. The large-scale modes show considerable cosmic variance. The small-scale behavior is affected by both redshift-space distortions and shot noise. However, when redshift-space distortions are included, the DESI DR1 data are compatible with the FLAMINGO data on all scales. By contrast, the power spectrum measured for S2 in fiducial coordinates would imply a highly significant tension with the model assumed in the simulation.
Other Images in This Article
Copyright and Terms & Conditions
© 2026. The Author(s). Published by the American Astronomical Society.

