

Image Details
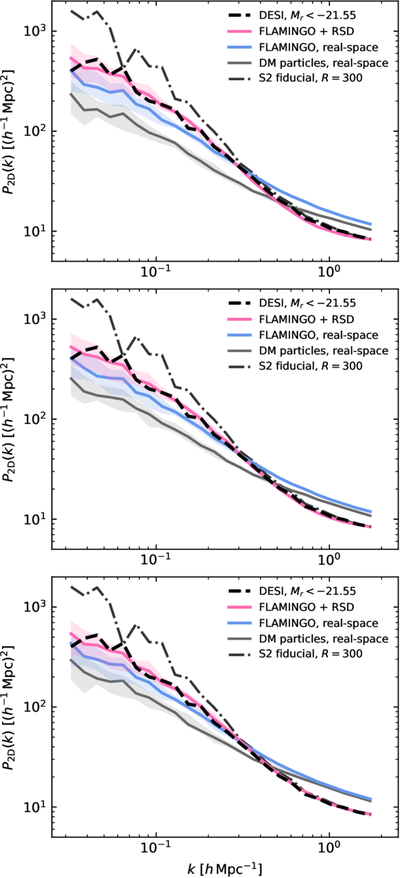
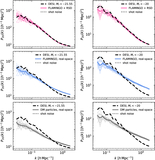
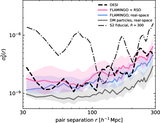
Caption: Figure 8.
Power-spectra comparison between DESI, S2, and slices of FLAMINGO at different redshifts. As in Figure 3, on all panels, the dashed black line shows the power spectrum in the R = 290 h−1 Mpc cylinder from DESI DR1, while the dashed–dotted black line shows the power spectrum measured for S2 in fiducial coordinates. From top to bottom, FLAMINGO data are computed from the snapshots at z = 0.25, z = 0.15, and z = 0.05, with results at z = 0.15 identical to Figure 3. The agreement with the DESI data and the disagreement with the S2 data are unaffected by the choice of simulation output in this redshift range.
Other Images in This Article
Copyright and Terms & Conditions
© 2026. The Author(s). Published by the American Astronomical Society.

