

Image Details
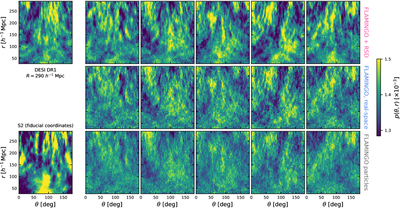
Caption: Figure 4.
Anisotropy, measured as the angular distribution of pairwise distances, as a function of pairwise distance, r, and angle, θ. The top-left panel shows the result within an R = 290 h−1 Mpc cylinder in DESI. The bottom-left panel shows the result for S2 at its fiducial scale. The next five columns show the results from FLAMINGO in the same five volumes shown in Figure 2. The top row shows results for FLAMINGO galaxies including redshift-space distortions, the middle row shows FLAMINGO galaxies in real space, the bottom row shows results measured from the dark-matter particles. FLAMINGO reproduces the statistical anisotropy observed in DESI, but only when compared at the correct scale, and when bias and redshift-space distortions are included. The anisotropy that would be inferred in S2 is much greater.
Other Images in This Article
Copyright and Terms & Conditions
© 2026. The Author(s). Published by the American Astronomical Society.

