

Image Details
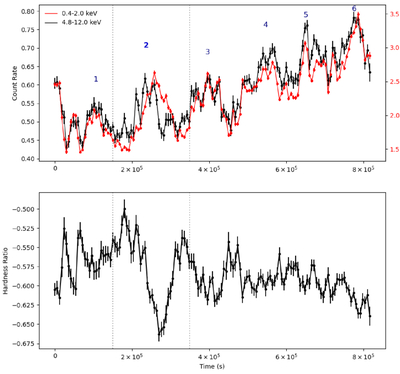
Caption: Figure 1.
(Top) XRISM/Xtend light curves (LCs) from the NGC 3783 observation campaign. Hard and soft X-ray LCs are plotted in black and red, respectively. The various peaks in the LC are numbered. The flare discussed in this Letter is the highlighted second peak. The segment of the observation shown in Figure 2 is marked by the dotted lines. Other than during this segment, the hard and soft X-ray LCs are highly correlated through most of the observation (Table 1). (Bottom) the hardness ratio (H − S)/(H + S). The hardness of the relevant flare is distinctly different from the rest of the observation.
Other Images in This Article
Copyright and Terms & Conditions
© 2026. The Author(s). Published by the American Astronomical Society.

Copyright ©
2026 Astronomy Image Explorer. All Rights Reserved.
