

Image Details
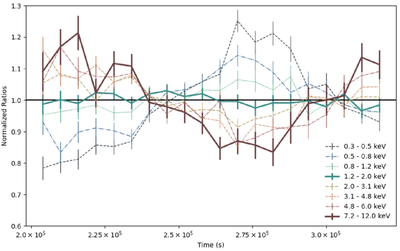
Caption: Figure 5.
The ratio between energy-sliced LCs of the flare in Figure 2 and the full LC at 0.3–12.0 keV. Slices have similar logarithmic widths. All light curves have been normalized to a mean of 1 for a meaningful ratio. The different temporal behavior of the hard and soft X-rays can be clearly seen. Highlighted are the bands that yield the most significant correlation between the hard X-ray (7.2–12 keV) LC and the derivative of the soft X-ray (1.2–2.0 keV) LC (Equation (1)). The latter band has the highest count rate, and thus is closest to the full LC shape. There are several common features within the soft (<2 keV) bands and distinctively within the hard (>2 keV) bands, indicating the soft and hard X-ray are emitted by different physical mechanisms. The 6.0–7.2 keV range is not presented as it contains strong Fe-K emission and absorption lines unrelated to the Neupert effect.
Other Images in This Article
Copyright and Terms & Conditions
© 2026. The Author(s). Published by the American Astronomical Society.

