

Image Details
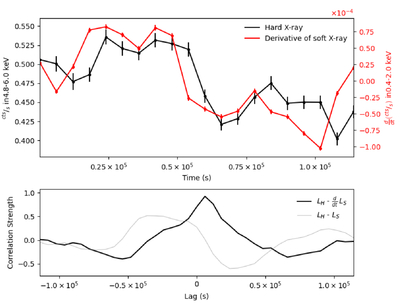
Caption: Figure 7.
Correlation using XMM-Newton EPIC-PN data between hard X-ray LC and the derivative of the soft X-ray LC demonstrating the Neupert effect (Equation (1)). (Top) hard X-ray LC in the 4.8–6.0 keV band (black) and time derivative of the soft X-ray LC in the 0.4–2.0 keV band (red). Time shown is from the start of the XMM observation. (Bottom) cross correlation between the hard X-ray LC (LH) and the derivative of the soft X-ray LC (LS), with a lag smaller than the 6 ks bin size (black). The insignificant cross correlation between the hard and soft X-ray LCs is shown in gray. This behavior mirrors the XRISM/Xtend LCs.
Other Images in This Article
Copyright and Terms & Conditions
© 2026. The Author(s). Published by the American Astronomical Society.

