Image Details

Choose export citation format:

Magnetic Field Stratification in Active-region Plage from Ca II K and Ca II 8542 Å Spectropolarimetry

  • Authors: Iñigo Juanikorena Berasategi, Ernest Alsina Ballester, Javier Trujillo Bueno, Francisco A. Iglesias, Yusuke Kawabata, Juan Sebastián Castellanos Durán, Masahito Kubo, Alex Feller, Yukio Katsukawa, Sami K. Solanki, Jose Carlos del Toro Iniesta, Andreas Lagg, Achim Gandorfer, Pietro Bernasconi, Thomas Berkefeld, Tino L. Riethmüller, Yoshihiro Naito, Alberto Álvarez-Herrero, H. N. Smitha, David Orozco Suárez, Bianca Grauf, Michael Carpenter, Alexander Bell, Valentín Martínez Pillet, Francisco Javier Bailén, Julian Blanco Rodríguez, Edvarda Harnes, Johannes Hölken, Ryohtaroh T. Ishikawa, Takuma Matsumoto, Takayoshi Oba, Azaymi L. Siu-Tapia, Hanna Strecker, Dušan Vukadinovic

Iñigo Juanikorena Berasategi et al 2026 The Astrophysical Journal Letters 1007 .

  • Provider: AAS Journals

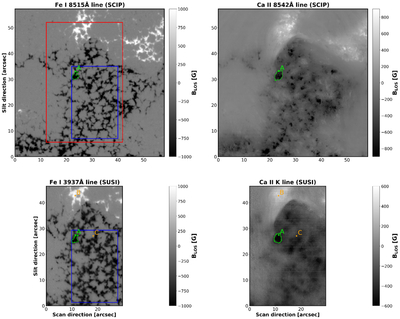
Caption: Figure 2.

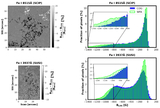
Magnetic field strength along the line of sight, BLOS, obtained by applying the COG method to the Fe I spectral lines (left panels), and the WFA to the Ca II lines (right panels), in the SCIP (upper panels) and SUSI (lower panels) datasets. The red rectangle indicates the position of the SUSI observation within the FOV of SCIP. This region is used to compute the magnetized area fraction in each map. The blue rectangle indicates the predominantly negative-polarity region analyzed later in this section. The green contours in the Fe I panels delimit a specific magnetic patch in the FOV where BLOS > 800 G, and the contours in the Ca II panels enclose the same magnetic flux as their Fe I counterparts.

Other Images in This Article
Copyright and Terms & Conditions

Additional terms of reuse