

Image Details
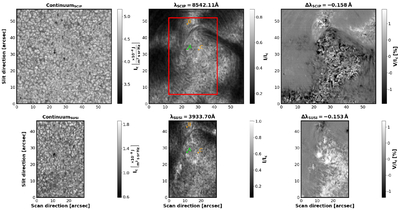
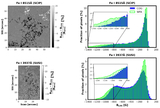
Caption: Figure 1.
Images of the intensity and circular polarization at selected wavelengths of the analyzed datasets. Upper panels correspond to the SCIP observation, and lower ones to SUSI’s. Left panels display intensity maps close to the continuum (around 3946 Å in SUSI and 8505 Å in SCIP), with the intensity given in SI units. Central panels show the core of the Ca II lines of interest (K in SUSI and 8542 Å in SCIP), normalized by the local continuum. The right panels display the circular polarization in the blue wing. The wavelength considered in each panel is indicated above it, with Δλ being the separation from the line core. The red rectangle indicates the position of the SUSI observation within the FOV of SCIP.
Other Images in This Article
Copyright and Terms & Conditions
© 2026. The Author(s). Published by the American Astronomical Society.

