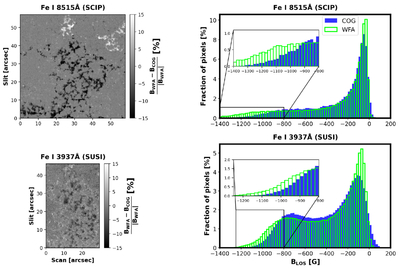
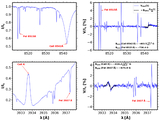
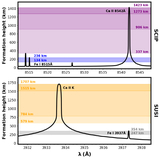
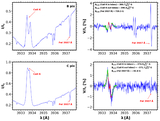
Left panels: maps of the relative difference, (BWFA − BCOG) / ∣BWFA∣, expressed as a percentage. Right panels: distributions of BWFA and BCOG within the region enclosed by the blue rectangle in Figure 2. The COG histograms are identical to those shown in the left panels of Figure 3.