

Image Details
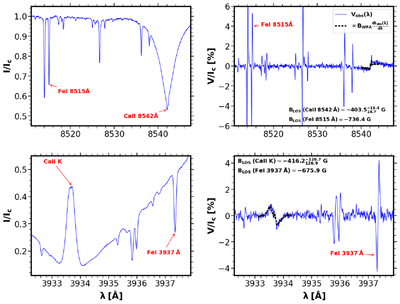
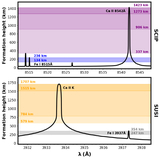
Caption: Figure 4.
Stokes intensity (I/Ic) and circular polarization (V/Ic) profiles, normalized to the local continuum intensity, for a pixel in region A (Figures 1 and 2) are shown in the left and right panels, respectively. Upper panels display SCIP data near the Ca II 8542 Å line, and the lower ones show SUSI data around the Ca II K line. In the intensity panels, we mark the four spectral lines considered in this work. In the right panels, we show the best-fit profiles (dashed black lines) in the spectral range where the WFA was applied for the Ca II lines, also normalized to the continuum. The longitudinal components of the magnetic field inferred for the considered Ca II and Fe I lines are also displayed in the right panels. The values from the Ca II lines are accompanied by the upper and lower uncertainties limiting a 95% confidence interval, as determined from the MCMC WFA method.
Other Images in This Article
Copyright and Terms & Conditions
© 2026. The Author(s). Published by the American Astronomical Society.

