

Image Details
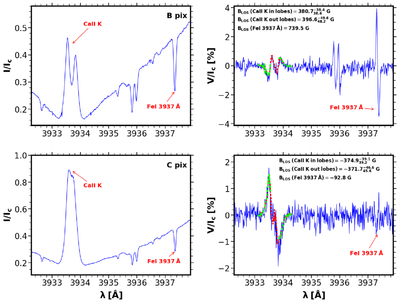
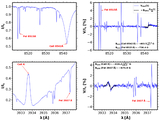
Caption: Figure 7.
Stokes intensity (I/Ic) and circular polarization (V/Ic) profiles, normalized to the local continuum intensity, are shown in the left and right panels, respectively. Upper and lower panels display the profiles corresponding to regions B and C, respectively, marked with orange dots in Figures 1 and 2. In the intensity panels, we mark the four spectral lines considered in this work. In the right panels, we plot the best-fit profiles in the inner (Δλ = ± 0.15 Å, dashed red lines) and outer (Δλ = ± [0.15, 0.6] Å, dashed green lines) lobes where the WFA was applied to the Ca II lines. The longitudinal components of the magnetic field inferred for the considered Ca II and Fe I lines are also displayed in the right panels. The values from the Ca II lines are accompanied by the upper and lower uncertainties limiting a 95% confidence interval, as determined from the MCMC WFA method.
Other Images in This Article
Copyright and Terms & Conditions
© 2026. The Author(s). Published by the American Astronomical Society.

