

Image Details
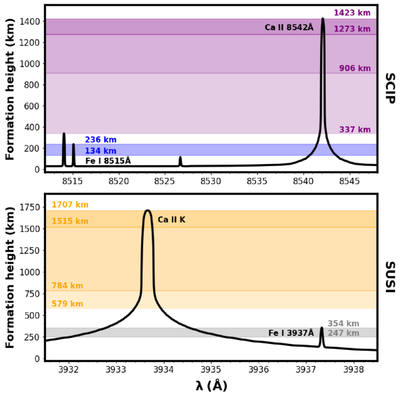
Caption: Figure 5.
Estimate of the formation height as a function of wavelength, defined as the geometric height where τ = 1 for a disk-center line of sight (μ = 1) and computed with HanleRT-TIC for the FAL-P atmospheric model. The upper and lower panels correspond to wavelength windows comparable to those shown for SCIP and SUSI, respectively, in Figure 4. For the Ca II lines considered in the analysis, we highlight with colored stripes the intervals between the τ = 1 heights of the following spectral features, ordered from larger to smaller height: the line core, the peaks of the inner and outer circular polarization lobes, and the continuum of the circular polarization. For the Fe I lines, only the intervals between the heights of the line core and the peaks of the V/Ic lobes are shown. All height values are indicated above their corresponding horizontal line. The Fe I 8514 Å and 8526 Å lines were also included in the calculations, at the blue and red sides of Fe I 8515 Å, respectively.
Other Images in This Article
Copyright and Terms & Conditions
© 2026. The Author(s). Published by the American Astronomical Society.

