

Image Details
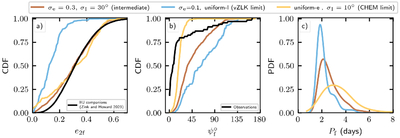
Caption: Figure 4.
Marginalized distributions of companion eccentricity (panel (a)), HJ obliquity (panel (b)), and final orbital period (panel (c)) from our simulations. The colored curves correspond to different assumed underlying distributions of the planets’ initial eccentricities and mutual inclinations. We focus on three regimes: the ZLK limit, the CHEM limit, and an intermediate case. In panel (a), the black curve shows the observed eccentricity distribution of HJ companions from J. K. Zink & A. W. Howard (2023). In panel (b), the black curve shows the obliquity distribution from Figure 1. The observed companion eccentricity distribution is consistent with both the intermediate case and the CHEM limit. The observed obliquity distribution contains more aligned systems than our simulations. The final-period distribution depends on the relative contributions of the different migration channels: The ZLK limit peaks at the shortest periods, the CHEM limit peaks at the longest periods, and the intermediate case peaks between these two limits.
Other Images in This Article
Copyright and Terms & Conditions
© 2026. The Author(s). Published by the American Astronomical Society.

