

Image Details
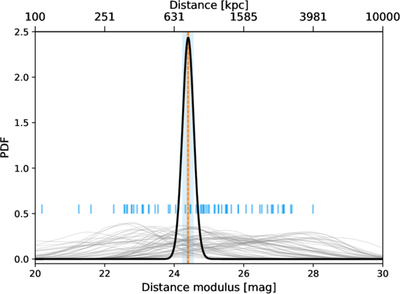
Caption: Figure 4.
Stellar population–based distance to the Andromeda galaxy. Light-gray lines correspond to the 66 individual posteriors for the distance modulus, with each median indicated with a small vertical blue line. The black solid line shows the combined measurement of the distance modulus, with the 1σ uncertainty indicated with a blue vertical shaded area. For reference, the μ0 value and uncertainty of S. Li et al. (2021) are represented by the vertical orange line and shaded region, respectively.
Other Images in This Article
Copyright and Terms & Conditions
© 2026. The Author(s). Published by the American Astronomical Society.

Copyright ©
2026 Astronomy Image Explorer. All Rights Reserved.
