

Image Details
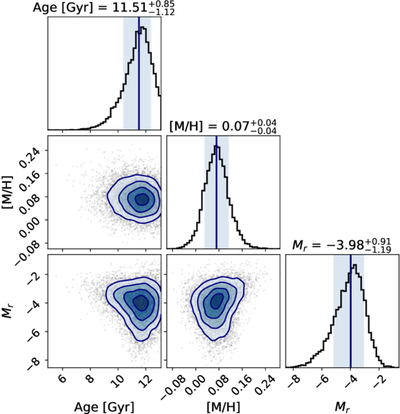
Caption: Figure 3.
Individual fit. The corner plot represents the posterior distribution for one representative spectrum based on the SBI measurement. On the histograms, the vertical lines indicate the median value and the shaded areas the 1σ uncertainties.
Other Images in This Article
Copyright and Terms & Conditions
© 2026. The Author(s). Published by the American Astronomical Society.

Copyright ©
2026 Astronomy Image Explorer. All Rights Reserved.
