

Image Details
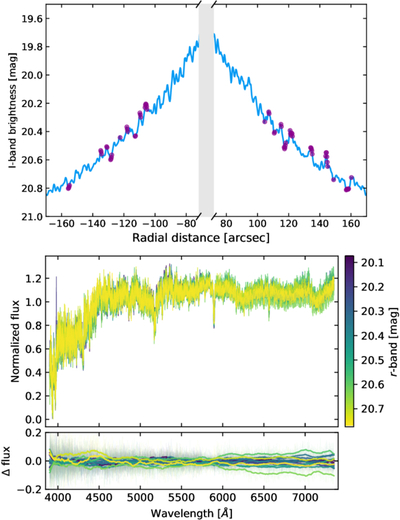
Caption: Figure 2.
(Top) The I-band brightness profile is shown in blue, with the regions corresponding to the spectra selected for the analysis marked with purple symbols. (Bottom) Some examples of different OSIRIS spectra, color-coded by their r-band magnitude. The bottom panel shows the smoothed (wide lines) and raw (thin lines) residuals with respect to the mean spectrum.
Other Images in This Article
Copyright and Terms & Conditions
© 2026. The Author(s). Published by the American Astronomical Society.

Copyright ©
2026 Astronomy Image Explorer. All Rights Reserved.
