

Image Details
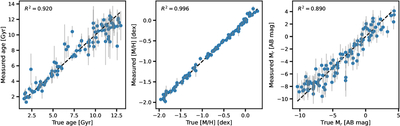
Caption: Figure 5.
The best-fitting age (left), metallicity (middle), and Mr (right) measurements for 100 test spectra are shown as a function of the ground truth. Error bars represent the 1σ uncertainty of each measurement. The label on the top corner of each panel shows the R2 value, while black dashed lines correspond to the 1–1 relation.
Other Images in This Article
Copyright and Terms & Conditions
© 2026. The Author(s). Published by the American Astronomical Society.

Copyright ©
2026 Astronomy Image Explorer. All Rights Reserved.
