

Image Details
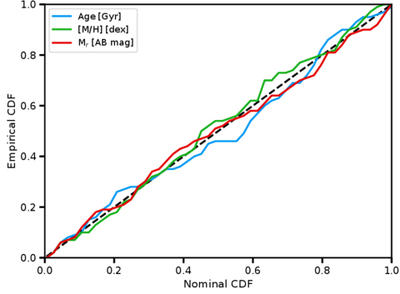
Caption: Figure 6.
Posterior coverage plot for the age (blue line), metallicity (green line), and Mr (red line) cumulative distribution functions (CDF). The black dashed line shows the expected relation for perfectly calibrated uncertainties.
Other Images in This Article
Copyright and Terms & Conditions
© 2026. The Author(s). Published by the American Astronomical Society.

Copyright ©
2026 Astronomy Image Explorer. All Rights Reserved.
