

Image Details
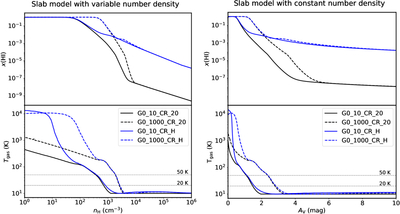
Caption: Figure 7.
Derived H I abundance (upper panels) and gas temperatures (lower panels) for a variable-density slab (left panels) and a constant-density slab (right panels) using the 3D-PDR code (T. G. Bisbas et al. 2012). The left panels are a function of the nH number density, whereas the right panels are a function of the visual extinction, AV. For each case, four models were run: (1) UV intensity G0 = 10 with LECRIR of 1 × 10⁻²⁰ s−1 (solid black lines); (2) UV intensity G0 = 103 with LECRIR of 1 × 10⁻²⁰ s−1 (dashed black lines); (3) UV intensity G0 = 10 with LECRIR following the ﹩{ \mathcal H }﹩ function (M. Padovani et al. 2018b; solid blue lines); and (4) UV intensity G0 = 103 with LECRIR following the ﹩{ \mathcal H }﹩ function (M. Padovani et al. 2018b; dashed blue lines).
Other Images in This Article
Copyright and Terms & Conditions
© 2026. The Author(s). Published by the American Astronomical Society.

