

Image Details
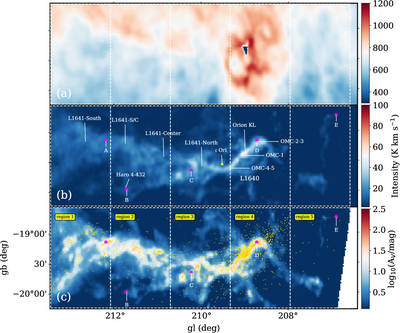
Caption: Figure 1.
Integrated intensity of H I (panel (a)) and 13CO(1–0) (panel (b)) toward the Orion region. The velocity range is from 0 to 15 km s−1 and a correction for the main beam efficiency has been adopted. The positions of well known clouds and stars are shown in panel (b). The distribution of young stellar objects overlaid on the Herschel extinction map is displayed in panel (c). The boundaries of the five subregions are delineated by white dashed lines, and the five positions A–E covering regions with different environments are indicated by magenta dots. Yellow dots indicate the positions of young stellar objects.
Other Images in This Article
Copyright and Terms & Conditions
© 2026. The Author(s). Published by the American Astronomical Society.

