

Image Details
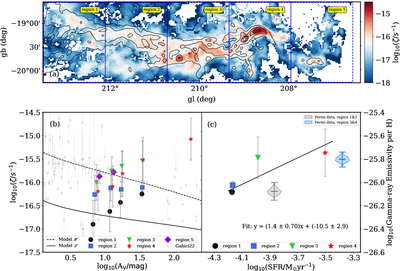
Caption: Figure 4.
(a) Spatial distribution of the low-energy cosmic-ray ionization rate (LECRIR); (b) median LECRIR values within five visual-extinction ranges ([5–10], [10–15], [15–20], [20–50], and [50–300] mag) across the five subregions of the Orion molecular complex. The representative AV values for these ranges are 7.5, 12.5, 17.5, 35, and 175 mag, respectively. Small offsets have been applied to the AV values of each subregion for clarity. Also shown are the Voyager-based ﹩{ \mathcal L }﹩ model (solid black line) and the reproduced diffuse-region ﹩{ \mathcal H }﹩ model (dashed black line; M. Padovani et al. 2018a, 2024), along with previous LECRIR measurements (gray dots) derived from ion tracers such as H﹩{}_{3}^{+}﹩, OH+, and HCO+ (S. Gabici 2022; N. Indriolo 2023). (c) Relationship between LECRIR and star formation rate for four subregions. The LECRIR for each subregion is estimated using the median value derived from areas with AV ≥ 15 mag. The linear fit between LECRIR and star formation rate is shown with a black solid line. The gamma-ray emissivities per hydrogen from the Fermi survey for the two groups (Regions 1 and 2 and Regions 3 and 4) are shown as violin plots for comparison, with their scale on the right-hand axis.
Other Images in This Article
Copyright and Terms & Conditions
© 2026. The Author(s). Published by the American Astronomical Society.

