

Image Details
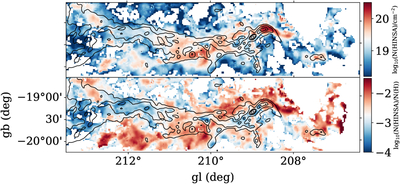
Caption: Figure 3.
Spatial distribution of the HINSA column density, N(HINSA) (top panel), and the HINSA abundance relative to total proton column density (bottom panel). The black contours indicate visual extinction of AV = [3, 10, 30, 50, 100] mag.
Other Images in This Article
Copyright and Terms & Conditions
© 2026. The Author(s). Published by the American Astronomical Society.

Copyright ©
2026 Astronomy Image Explorer. All Rights Reserved.
