

Image Details
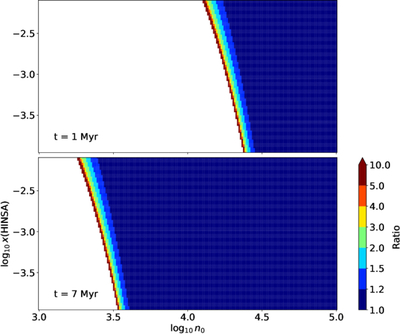
Caption: Figure 6.
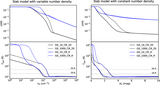
Distribution of the ratio between the LECRIR derived under the steady-state assumption and that derived for finite chemical ages (Equation (7)), shown as a function of gas number density n0 and HINSA abundance x(HINSA). The upper and lower panels correspond to chemical ages of t = 1 Myr and t = 7 Myr, respectively. White regions indicate NaN values, where the HINSA abundance cannot be reproduced under the steady-state assumption.
Other Images in This Article
Copyright and Terms & Conditions
© 2026. The Author(s). Published by the American Astronomical Society.

Copyright ©
2026 Astronomy Image Explorer. All Rights Reserved.
