

Image Details
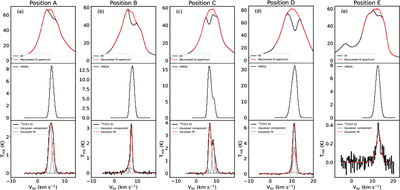
Caption: Figure 2.
Fitting profile of HINSA toward the positions A–E shown in Figure 1. The top panel shows the observed H I spectrum (black) and the recovered H I spectrum without self-absorption (red). The middle panel displays the HINSA profile. The 13CO(1–0) spectrum, Gaussian fitting components, and the overall fitting profile are shown as solid black, solid gray, and red dashed lines, respectively, in the lower panel.
Other Images in This Article
Copyright and Terms & Conditions
© 2026. The Author(s). Published by the American Astronomical Society.

Copyright ©
2026 Astronomy Image Explorer. All Rights Reserved.
