Image Details
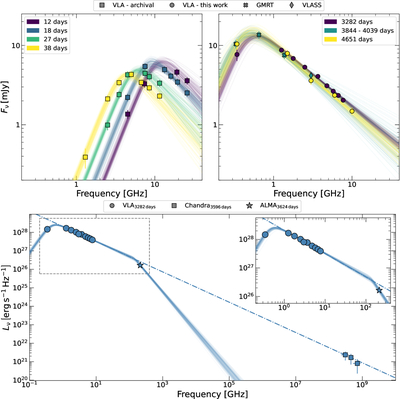
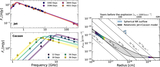
Caption: Figure 3.
The near-simultaneous SEDs of SN 2012ap in the time interval of δt ∼ 12–4561 days. The top left panel shows the early observations by S. Chakraborti et al. (2015) from δt ∼ 12–38 days, while the top right panel shows the late-time radio emission reported here. We fit the SEDs with the broken power-law function described in Equation (4). The bottom panel presents the broadband radio-to-X-ray SED. Here, we fit the radio-to-millimeter emission with a double broken power-law function (VLA+ALMA; solid lines). In addition, we show the extrapolation of the middle segment power-law to the X-ray bands (dotted-dashed line). This extrapolation naturally accounts for the observed X-ray emission (which was not fitted). However, it overestimates the emission in the millimeter band, which is easily explained by a break frequency introduced at νc = 140 ± 20 GHz. See the detailed discussion in Section 5.1.
Other Images in This Article
Copyright and Terms & Conditions
© 2026. The Author(s). Published by the American Astronomical Society.