Image Details
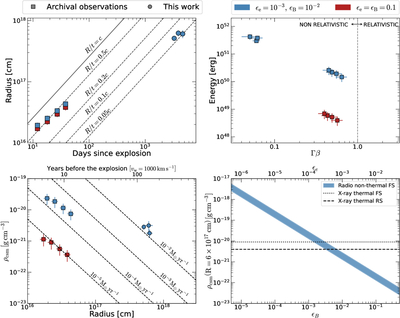
Caption: Figure 4.
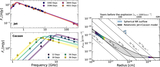
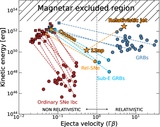
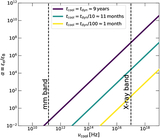
Physical parameters inferred from the fits of the individual SEDs and the SSA analysis (see Section 5.1.1). The top left panel shows the temporal evolution of the radius, and the top right panel presents the energy-velocity profile. The bottom left panel is for the density profile; also plotted for reference are lines of equal mass-loss rate assuming a wind velocity of 1000 km s−1. In the bottom right panel, we present the density of the CSM at R = 6 × 1017 cm derived from the late-time radio SEDs for different values of ϵB while keeping a constant ratio of ϵe/ϵB = 0.1 (blue stripe). We also plot the density at R = 6 × 1017 cm derived from the analysis of the X-ray emission using an FS model (dotted line) and an RS model (dashed line). This is discussed in detail in Section 5.1.2. The analysis presented in the bottom right panel was used to determine ϵB ≃ 10−2 and ϵe ≃ 10−3 in our SSA analysis (the results of this are shown in the other three panels).
Other Images in This Article
Copyright and Terms & Conditions
© 2026. The Author(s). Published by the American Astronomical Society.