Image Details
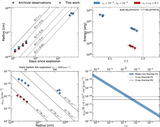
Caption: Figure 5.
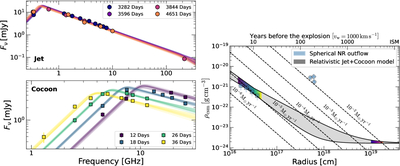
Best-fitting results for the jet+cocoon model using VegasAfterglow code. The top left panel is for the late-time radio emission observed with the VLA, GMRT, and ALMA, modeled with the jet component. The bottom left panel is for the early time radio emission observed with the VLA and modeled with the wide-angle outflow (i.e., the cocoon). The lines are drawn from the posterior distributions shown in Figure 8 in Appendix C. The right panel presents the density profile inferred from this modeling (shaded gray region) together with the results from the analysis in Section 5.1.1 (see Figure 4). The colored regions within the gray region are for the radii for which we have radio observations. We summarize the parameters of this model in Table 5.
Other Images in This Article
Copyright and Terms & Conditions
© 2026. The Author(s). Published by the American Astronomical Society.