Image Details
Caption: Figure 1.
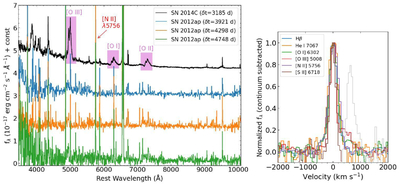
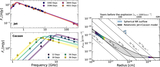
Left: LRIS spectral sequence of SN 2012ap compared to the interacting SN 2014C at late times. The purple shaded regions mark the broad (FWHM ∼5000 km s−1) oxygen emission lines from ejecta illuminated by the CSM interaction region in SN 2014C. These are not present in SN 2012ap, while narrow [N II] λ5756 emission is unusually prominent. All spectra have been dereddened by assumed values of E(B − V)=0.75 mag (SN 2014C, D. Milisavljevic et al. 2015c) and 0.6 mag (SN 2012ap, D. Milisavljevic et al. 2015b). Right: line profiles in the δt = 4298 day spectrum of SN 2012ap, demonstrating a lack of broad (FWHM ≳ 1000 km s−1) emission from SN ejecta. The [S II] λ6733 line is grayed out for clarity. The LRIS spectra are available as the data behind the figure.
(The data used to create this figure are available in the online article.)
(The data used to create this figure are available.)
Other Images in This Article
Copyright and Terms & Conditions
© 2026. The Author(s). Published by the American Astronomical Society.