Image Details
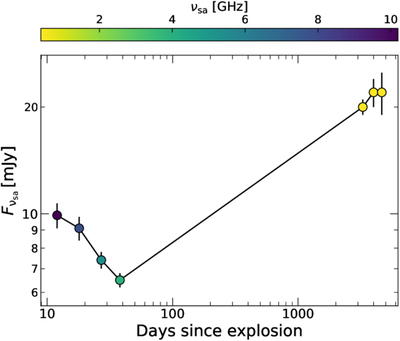
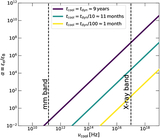
Caption: Figure 2.
The evolution of the flux density at the radio spectral peak with time. We color-code this plot by the position of peak frequency. These values are inferred from fitting Equation (4) to the broadband radio SEDs (see Section 5.1.1 for a detailed discussion and Table 3 for the fitted parameters).
Other Images in This Article
Copyright and Terms & Conditions
© 2026. The Author(s). Published by the American Astronomical Society.
Copyright ©
2026 Astronomy Image Explorer. All Rights Reserved.