Image Details
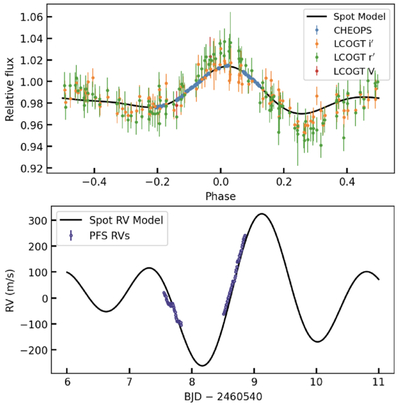
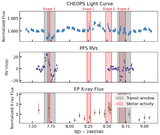
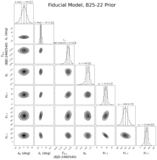
Caption: Figure 6.
Upper panel: long-term ground-based photometric observations and the CHEOPS light curve, plotted with the best-fit starry spot model. The data are phase-folded to the rotation period of 4.86 days. We employ spherical harmonics up to the third degree to construct the spot model. Lower panel: the predicted RV variation derived from the best-fit spot model compared to the observed PFS RVs. The spot model can qualitatively match the variation trend of the observed data.
Other Images in This Article
Copyright and Terms & Conditions
© 2026. The Author(s). Published by the American Astronomical Society.
Copyright ©
2026 Astronomy Image Explorer. All Rights Reserved.