Image Details
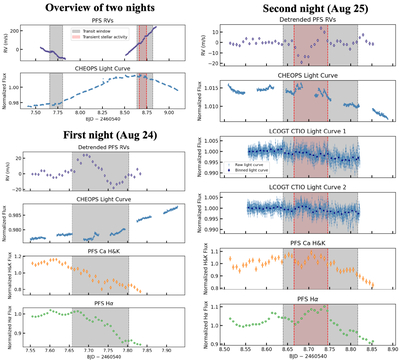
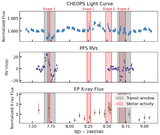
Caption: Figure 1.
RVs, light curves, and stellar activity indicators for AU Mic b and c transits observed on consecutive nights (local dates labeled). Gray shaded regions denote the transit window for each planet. Red shaded regions highlight a transient stellar activity event on the second night that affected all collected data during planet c’s transit.
Other Images in This Article
Copyright and Terms & Conditions
© 2026. The Author(s). Published by the American Astronomical Society.
Copyright ©
2026 Astronomy Image Explorer. All Rights Reserved.