Image Details
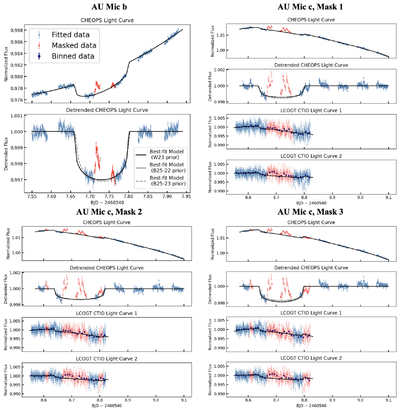
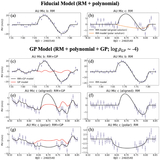
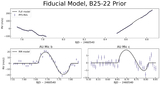
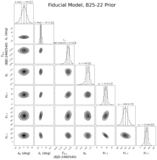
Caption: Figure 3.
Transit fitting results for AU Mic b and c. For AU Mic c, three fits using different flare-masking choices are presented. Blue dots represent the data used in the fit, while red dots indicate masked data points. The solid black lines represent the best-fit transit models using the W23 prior. For the detrended CHEOPS data, additional best-fit models using alternative priors are shown as solid and dashed gray lines; these exhibit only marginal deviations from each other. Priors used: W23: based on J. M. Wittrock et al. (2023); B25-22 and B25-23: based on 2022 and 2023 values of Á. Boldog et al. (2025), respectively.
Other Images in This Article
Copyright and Terms & Conditions
© 2026. The Author(s). Published by the American Astronomical Society.