Image Details
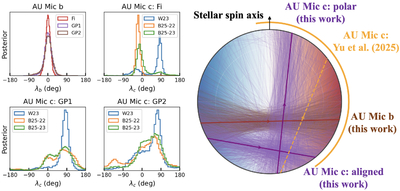
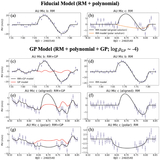
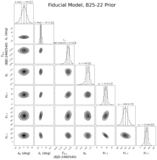
Caption: Figure 4.
Left panels: posterior distributions of the projected stellar obliquities of AU Mic b and c (λb and λc) for representative modeling results, presenting differences in prior choices and the inclusion of the GP. Right panel: illustration of the transit configurations of AU Mic b and c derived from our posteriors. We plot the fiducial model under the B25-22 prior for b, and the fiducial model under the B25-23 and W23 priors simultaneously for c. Thin lines represent randomly selected samples from the posterior samples. Bold solid lines denote the median for each solution. The orange dashed line and solid arc show the median model and 2σ range constrained by H. Yu et al. (2025), respectively. The background blue and red colors indicate local RVs (blueshift and redshift) across the stellar hemispheres induced by stellar rotation. Abbreviations used in this plot: Fi: fiducial model; GP1: GP model with a timescale prior from H. Yu et al. (2025) (﹩\mathrm{log}{\rho }_{{\rm{GP}}}\sim -4﹩); GP2: GP model with a timescale prior trained on activity indicators (﹩\mathrm{log}{\rho }_{{\rm{GP}}}\sim -2.8﹩); W23: transit prior based on J. M. Wittrock et al. (2023); B25-22 and B25-23: transit prior based on 2022 and 2023 values of Á. Boldog et al. (2025), respectively.
Other Images in This Article
Copyright and Terms & Conditions
© 2026. The Author(s). Published by the American Astronomical Society.