Image Details
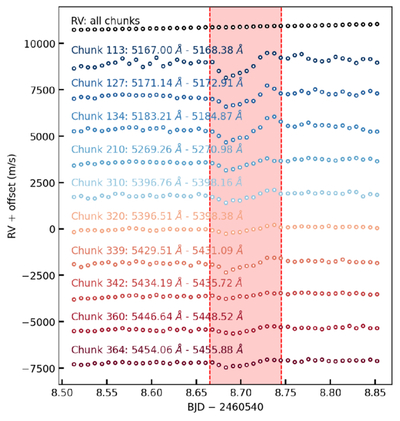
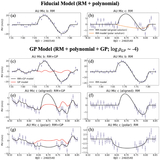
Caption: Figure 2.
RVs of the 10 PFS spectral chunks most affected by the transient stellar activity, plotted alongside the combined RVs from all chunks for comparison. Wavelength ranges are indicated in the plot for each chunk (star rest frame in air). The red regions denote the duration of the transient stellar activity. Note that the amplitude of activity in these chunks reaches thousands of m s−1. On this scale, the influence on the combined RVs is not visible.
Other Images in This Article
Copyright and Terms & Conditions
© 2026. The Author(s). Published by the American Astronomical Society.
Copyright ©
2026 Astronomy Image Explorer. All Rights Reserved.